In this brief analysis we expand on our previous blog. We compared how SMA’s longest running...
With current market volatility, we are frequently asked how our data is performing. The chart below is the YTD Open-To-Close return of common stocks with an S-Score > 2 or S-Score <-2 prior to Market Open. S-Scores are effectively Z-Scores. An S-Score > 2 means the conversation over the last 24 hours is 2 standard deviations more positive than it has been over the last 20 days. This is bullish for the stock price. Our patented NLP fine grain scores each Tweet using a multi-pass phrase evaluation approach. Tweets from our influential universe of accounts are aggregated into S-Scores every minute.
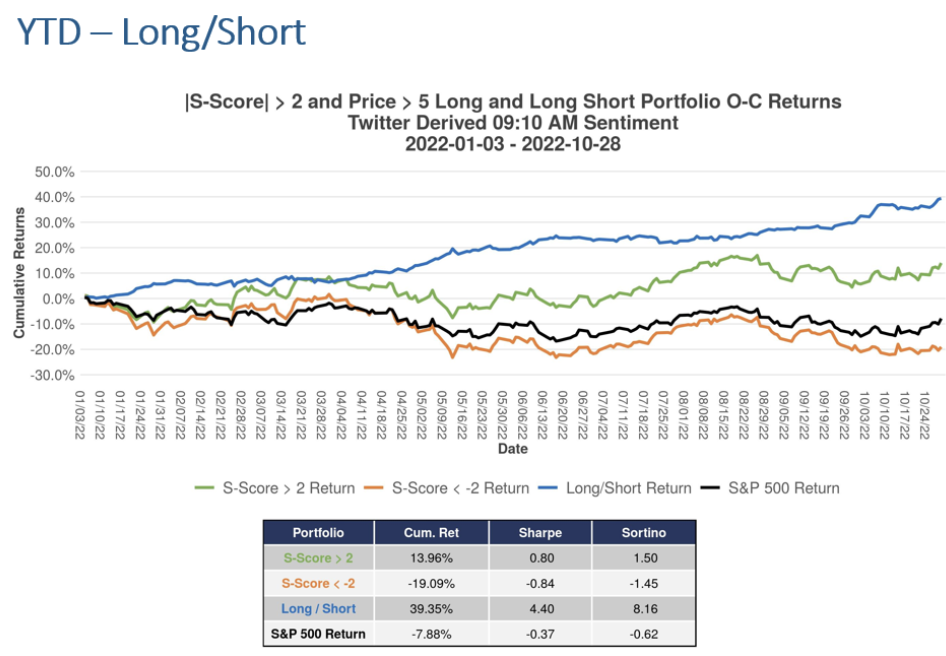
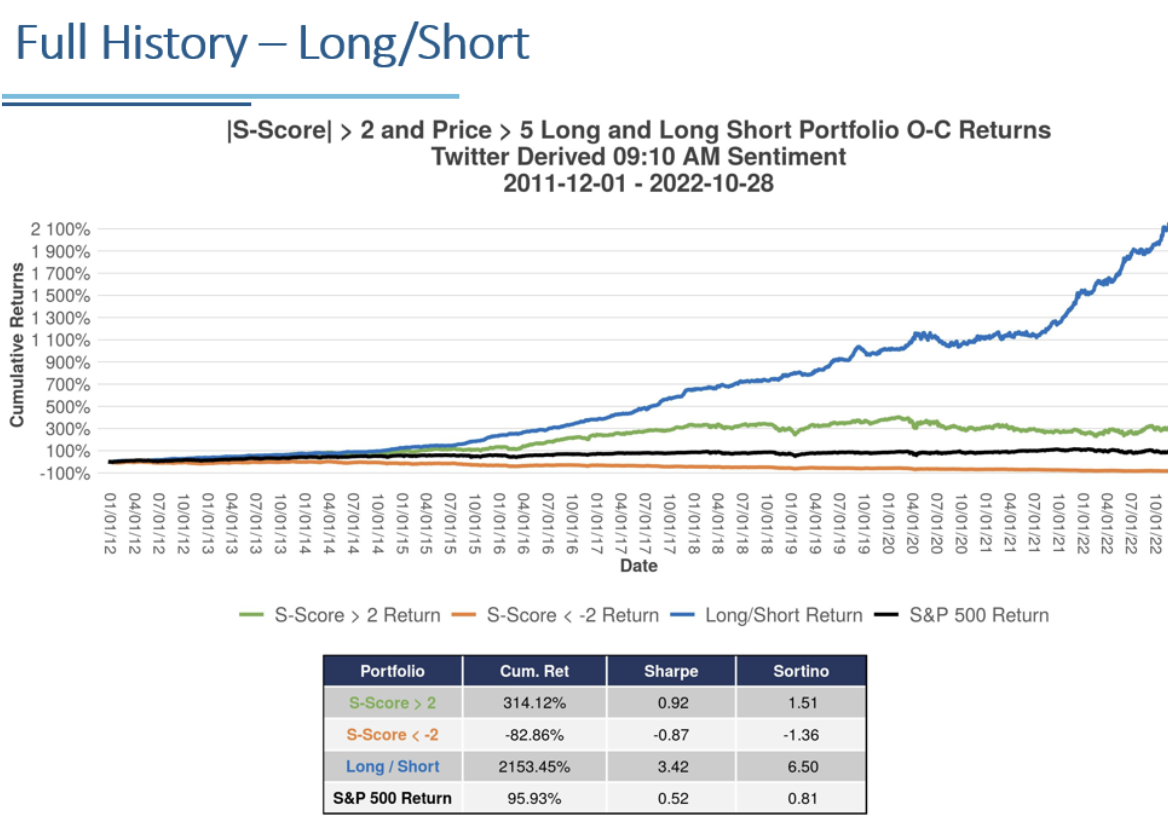
The green line above represents the subsequent Open-to-Close performance of stocks with and S-Score > 2 prior to market open. We added SP500 Open-to-Close return (Black Line) for comparison purposes. As you can see positive conversations lead to outperformance. The red line represents stocks with a conversation more negative than prior its historical baseline. In this case negative return for the red line represents positive alpha. A theoretical Long/Short portfolio is represented by the blue line.
The chart below represents the full history of the prior chart. We use supervised and unsupervised machine learning to evaluate our NLP to improve scoring and expand our lexicon. The increasing slope of the Long/Short line illustrates the benefits of the extensive training we have done over the last 10 years. Sortino ratios of YTD when compared to full history illustrates that our “learning” is adding value.