Following our initial research on Context Analytics’ Quantitative News Feed sentiment with daily...
In this blog we explore Social Market Analytics’ (SMA) longest running trading strategy based on the S-Score from the S-Factor dataset. Before diving into the strategy’s results, let go over what the S-Score calculates.
Social Market Analytics evaluates all messages sourced from Twitter and StockTwits that contain key phrases tagging a security. Each message is graded from -1.0000 to 1.0000 using proprietary Natural Language Processing (NLP), which is aggregated by security to create S-Factors. From the StockTwits data feed, SMA includes messages from all users because the StockTwits users are educated investors. From the Twitter data feed, SMA uses its source rating algorithm to evaluate a user’s features which includes follower count, account age, tweet frequency, ticker diversity, prediction accuracy, etc. Once a user passes the algorithm threshold, Tweets from the account will be included in the S-Factors moving forward.
Social Market Analytics’ S-Factor feed evaluates messages from each source separately (Twitter and StockTwits). Below are the steps taken to calculate S-Score:
- Exponentially sum the sentiment from messages in the past 24 hours by security (graded from -1.0000 to 1.0000). Messages closer to the current time hold more weight than messages from 23 hours ago.
- Calculate a 20-day mean and standard deviation from Step 1 to create a baseline for each security.
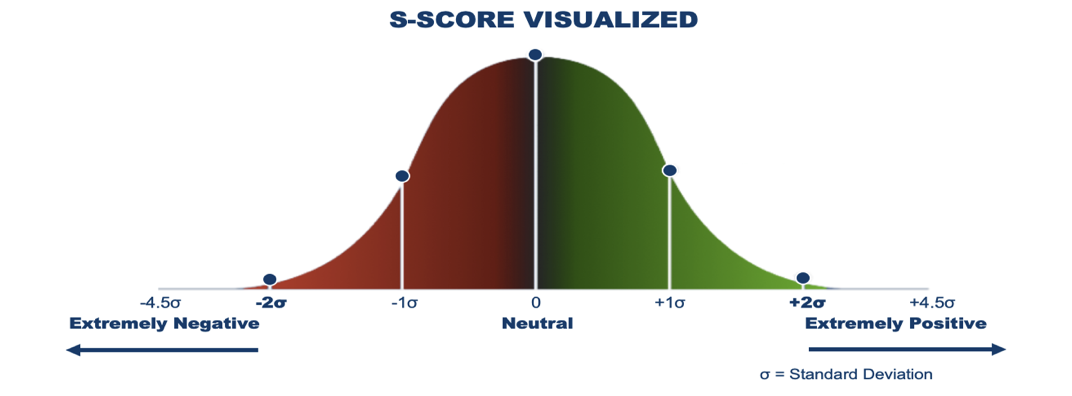
- Create a z-score using the sum from Step 1 and baseline factors from Step 2. This score roughly follows a normal distribution as shown below.
The S-Score tells us how positive/negative the tone of the current conversation is compared to its historical average. If conversation is extremely positive, or higher than two standard deviations from the mean, then we expect the subsequent return of that security to outperform the market. On the other side, securities with extremely negative conversation will underperform.
 Using S-Score as a standalone metric, we create a hypothetical strategy on a universe of securities with Price > $5 to exclude penny stocks and other securities with liquidity concerns. Each day we look at the S-Score 20 minutes before execution. For daily trading rebalancing at Market Close, we use S-Scores at 3:40pm ET. We then bucket securities by the criteria below:
Long: S-Score >=2
Short: S-Score =< -2
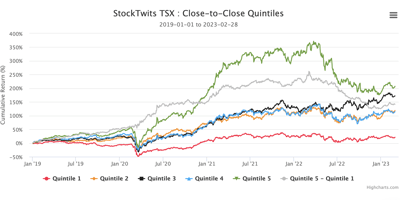
We take an equally weighted average of Close-to-Close returns from each bucket to calculate its return. The Long/Short is an equal weighted combination of the two portfolios. Below are the table for this strategy using the Twitter and StockTwits data.
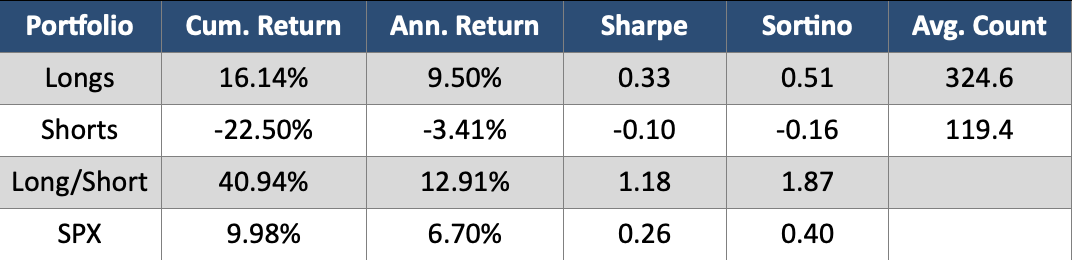
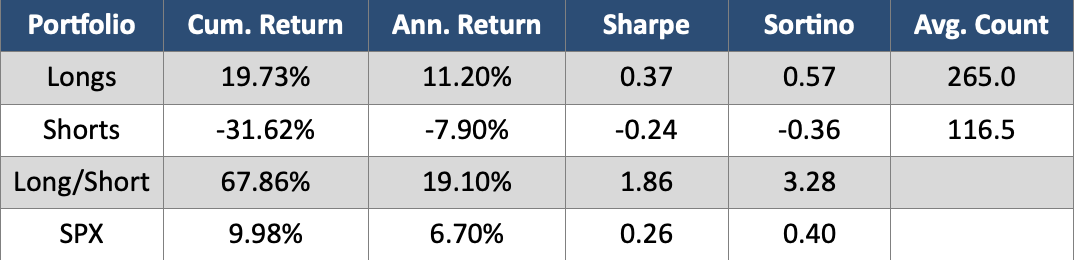
As shown in the plots above, both Twitter and StockTwits provide S-Score signals that are conducive to Long/Short trading. From both sources, the Short portfolio significantly underperforms the general market while the Long portfolio outperforms. The steadiness of the Long/Short lines in both plots demonstrate reduced volatility amongst daily returns which helps the Sharpe Ratio. StockTwits’ S-Score signals have been stronger and more consistent over the past 2.5+ years, highlighted by the larger Annualized Returns and stronger Sharpe Ratio. Twitter does provide more overall signals (on average 60 on the Long Side and 3 more on the Short side), mainly due to more messages being sent on the platform.
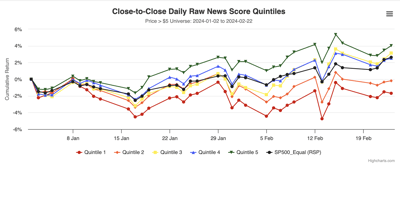
Next, we’ll look at the same strategy, but without any overnight position. We look at the S-Score at 9:10am ET to trade from Market Open to Market Close. Below are the results:
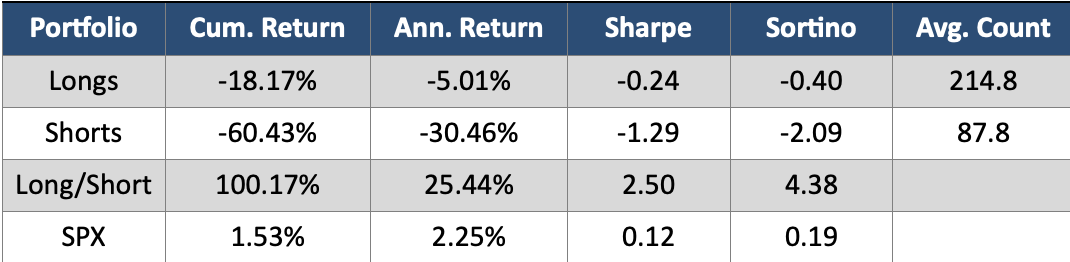
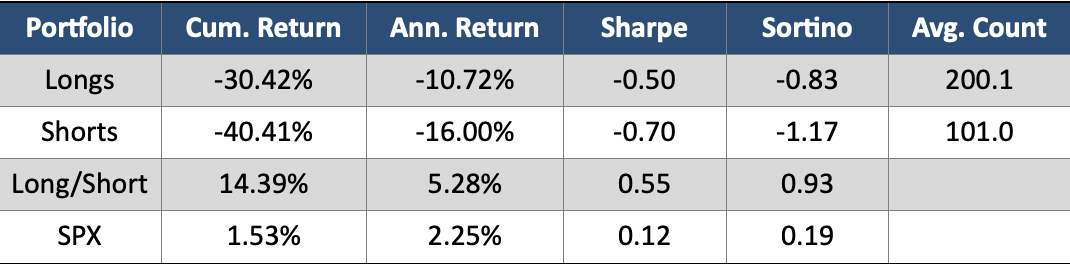
These graphs show that over the past 2.5+ years, securities with extreme sentiment will underperform during market hours. However, the spread between the Long and Short from both sources is promising. On Twitter, the Long/Short has an outstanding Sharpe Ratio of 2.50 and an Annualized Return of 25.44% during a time of market instability. Twitter is showing a stronger positive bias on sentiment as displayed by the Average Count of securities in each basket. Twitter averages 15 more Long signals per day whereas it has 13 less Short signals. This could be due to user behavior, as StockTwits users are generally more informed investors and are better able to express their Shorts
Overall, these portfolios show the power of using Social Market Analytics’ S-Score for Long/Short trading. All Long/Short strategies above outperformed the market with reduced risk. We have seen Twitter perform better during market hours while StockTwits signals are better for overnight trading. Because these are two unique sources of textual data, different conversations happen on each platform, and different securities have extreme sentiment. Social Market Analytics is here to extract the power of textual data by making it quantitative.